
")
")
Services
Services


Services
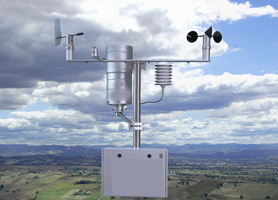
Stack Emission refers to the release of pollutants, gases, and particulate matter into the atmosphere from industrial sources, such as power plants, refineries, and manufacturing facilities, through stacks or chimneys, which can have detrimental effects on air quality, human health, and the environment, contributing to climate change, acid rain, and other environmental problems, while also posing serious health risks to nearby communities, including respiratory issues, cardiovascular disease, and cancer, due to the inhalation of toxic pollutants, such as particulate matter, sulfur dioxide, nitrogen oxides, volatile organic compounds, and heavy metals, which can also accumulate in soil and water, contaminating ecosystems and affecting wildlife, highlighting the need for stringent regulations, monitoring, and control measures to minimize stack emissions and mitigate their harmful impacts.


Services
Liquid Effluent provides valuable information on the quality and composition of the wastewater, which is essential for developing effective treatment strategies, ensuring compliance with environmental regulations, and protecting public health. The testing process typically involves collecting and analyzing samples of the effluent, using various laboratory techniques and instruments to measure parameters such as pH, temperature, turbidity, and levels of pollutants like heavy metals, pesticides, and bacteria. This information is then used to design and optimize wastewater treatment systems, as well as to monitor the effectiveness of treatment processes and identify areas for improvement. Additionally, liquid effluent testing can also help identify potential environmental and health risks associated with the discharge of untreated or inadequately treated wastewater into waterways.


")
Services
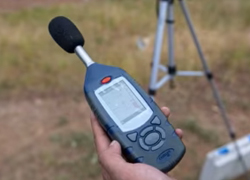
Sound or Noise level Monitoring (or simply fright noise) is a procedure to measure the loudness of whatever kind, whether it’s around industrialization or residential areas. We test and monitor noise levels to see what we need to do to combat pollution. This type of noise we call noise pollution is low-frequency sound or high-frequency sounds which can disrupt people’s normal behaviour. With the growth of technological civilization, all kinds of Industrial Machines, Motor Vehicles and Crafts also emit various sounds. All these are sources which can cause noise pollution. Man himself has inflicted the plague of noise pollution on many people due to rapid development in recent years. Therefore, the Monitoring process for noise Pollution is a kind of monitoring that falls under Environmental Monitoring testing.


Services


Services


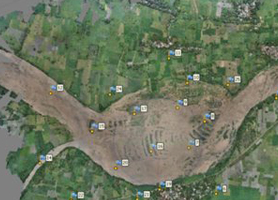
The Railway Survey or Station Survey is an investigation to gather data on the proposed route of a railway line. It involves collecting information on the terrain, geography, and existing infrastructure along the proposed route. This data is used to determine the feasibility of the project, identify potential challenges, and inform the design and planning of the railway line. The survey typically includes geological, geotechnical, and environmental assessments to identify potential risks and opportunities. The data collected during the survey is used to create detailed maps, profiles, and models of the proposed route, which are then used to inform the design and construction of the railway line.


Services


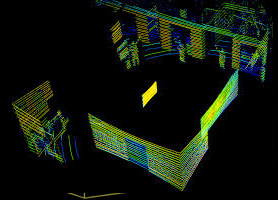
3D Point Clouds represent a critical aspect of Reality Capture, providing a precise and detailed snapshot of the spatial conditions of a building or space. These point clouds consist of millions of individual points, each accurately positioned in X, Y, and Z coordinates, and often accompanied by greyscale or color information. This comprehensive data capture method is particularly valuable when integrated with modeling softwares.


Services


Contour Survey is surveying the variation in the elevation of the earth’s surface and their relative positions are determined with help of contour lines. The process to find out the contour lines in the ground surface or earth surface is called contouring and a map is produced by this contouring process is called contour map. It is determination of elevation of various points on the land and fixing these points of same horizontal positions in the contour map. In the land property world, a contour is an outline of a mass of land. Main objective of conducting contour surveys is to identify any noticeable difference in elevation of the existing land. In land surveying a contour map is a map illustrated with contour lines, for example a topographic map, which thus shows valleys and hills, and the steepness or gentleness of slopes.


Services


Land Survey is a comprehensive process involves precise measurement, mapping and analysis of piece of land, wheher is a small plot or a vast area. The main objective of a land survey are to establish and document accurate information about land’s physical characterstics, boundries, and features. A land survey combines precise measurements, mapping and legal documentation to establish and verify essential information about a piece of land. It plays a critical role property ownership development and construction, ensuring that everything is accurately represented and in compliance with the law. Surveyors, who are trained professionals, carry out these surveys to provide accurate and reliable data about land properties.


Services
Copyright by Vecgroup. All rights reserved.
Copyright by Vecgroup. All rights reserved.
AVANTAGEHeadquarters
ASHOK NAGAR, RANCHI,
JHARKHAND, (834002).OUR LOCATIONSWhere to find us?

AVANTAGEHeadquarters
OUR LOCATIONSWhere to find us?

GET IN TOUCHAvantage Social links